

Tracking your progress
Logging a workout takes seconds. The payoff is everything Durata builds from it automatically: a calendar of every session, analytics that spot trends you'd never notice, a board of personal records, and goals that forecast their own finish date.
None of it needs any extra input. Every completed set feeds the Progress hub, the PR Board and Goals at the same time. This page explains what lives where.
Last reviewed 2026-09-15 · matches app v1.0.0.87
History: your training calendar
History is the second tab in Progress. It opens on a month calendar, three months side by side on wider screens, with a dot on every day you trained, and a full-year heatmap below it so a consistent block of training (or a gap) is visible at a glance. Tap a marked day to open that session.
Unilateral sets, logged one side at a time, always show their split, like 5 / 5, rather than a combined total, both in the session summary and while editing. Volume for these sets is counted once from that true per-side total, not doubled the way a genuine two-dumbbell bilateral set is.
Every program run you have finished is filed here too, under Past Runs, scoped to whatever period the calendar is showing, with an All Time switch when you want the lot. Training holds what you are going to do; Progress holds the record of what you did.
Train at more than one gym and History says so. Each session carries the gym it happened at, filter chips appear above the list once your history spans more than one venue, and a session stamped with the wrong gym can be corrected from its own edit screen. The Gyms guide covers venue records and what a best-here means.
The streak chip at the top mirrors the dashboard's, so the number always matches. A streak survives up to 3 rest days; the chip turns amber at 2 and red at 3 to warn you before it breaks. And if you've nothing logged yet, History doesn't sit empty. It explains what will build up there and offers a Log Your First Workout button to get the calendar started.
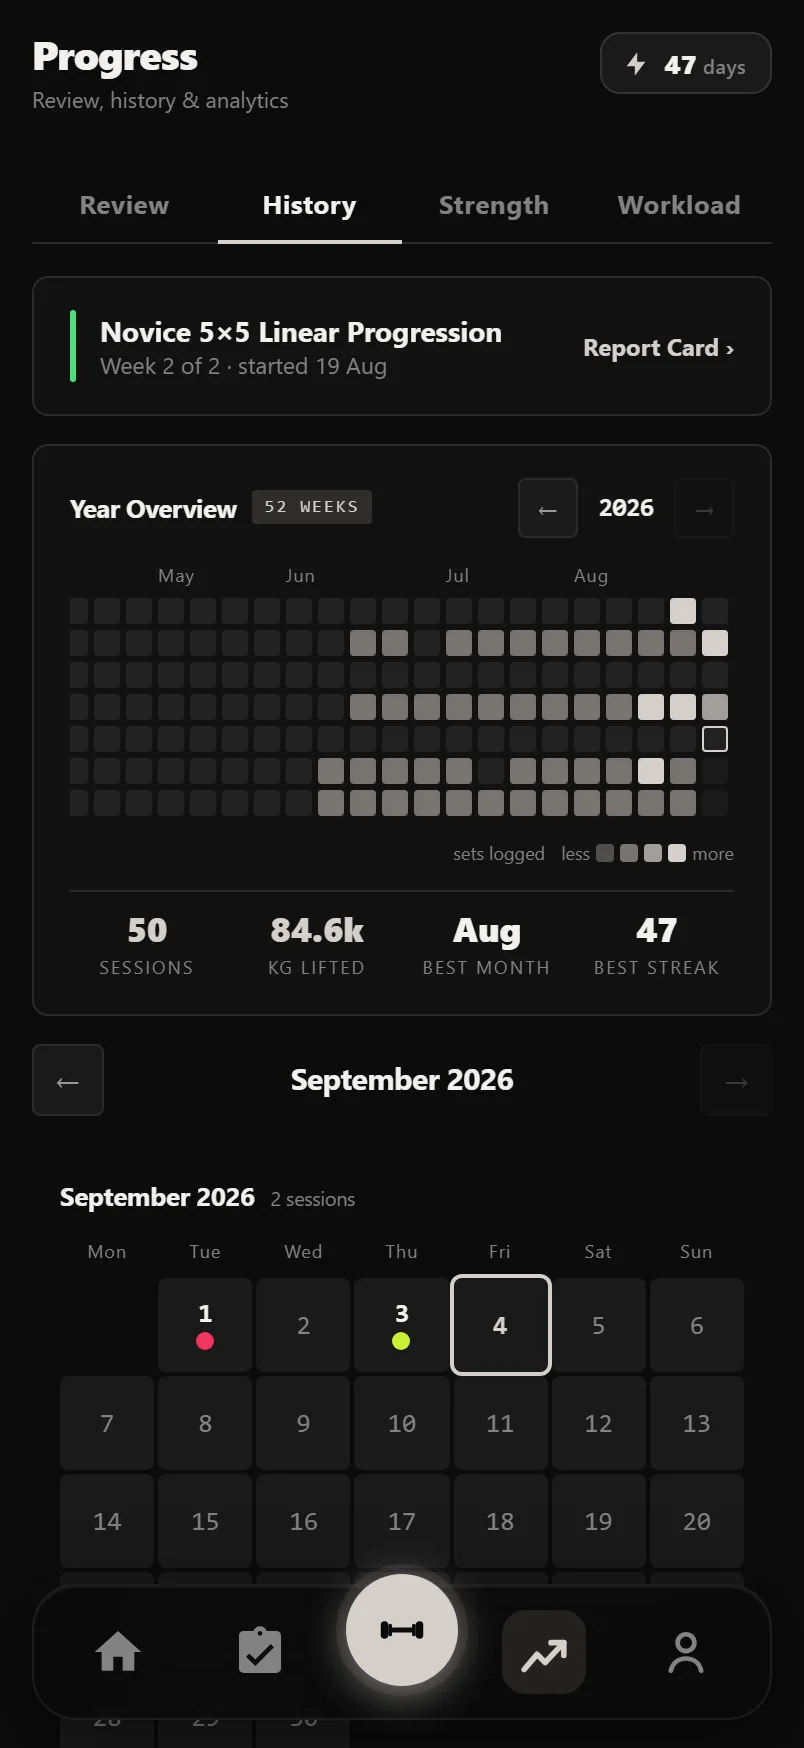
Swipe the calendar to change months and the year heatmap to view previous years, with no need to reach for the arrows.
Tap the streak chip for a plain-English explainer of exactly how streaks are counted.
A logged session, top to bottom
A session page reads top to bottom as a report on that workout. If you took a photo at the end of it, the page opens on the photo. Under it comes one plain sentence about how the session went: what you moved, which way it went against the last session of the same name, and which lift moved most. Then the numbers: volume, sets, reps and duration, each carrying its own comparison. A session that was only cardio swaps those for its own: the minutes trained, the distance and pace if you logged a distance, the sets, and the clock time kept separate and labelled as the session rather than as the training, so a 20-minute ride you paused twice inside half an hour reads as 20 minutes here, the same as it does under You > Cardio. Its card in the History list reads the same way. Then one Top Sets row per lift, How It Went, the muscle split with its push/pull/legs balance, and Notables. Your session notes come next, then The Log, which is every set of every lift exactly as you entered it. At the foot sits a button to the session either side of this one, each naming where it goes.
Records sit on the lift that earned them. Each Top Sets row gives that lift's best working set, the estimated 1RM it implies, how many working sets you did, and how it compares with the last session of the same name, by weight, or by reps when the weight could not move, which is how a set of pull-ups that went from 8 to 10 still reads as progress. A row that broke a record wears a tag for each one it broke: NEW PR for best weight, e1RM PR, VOL PR for best single set. A lift that is only your best at that gym reads BEST HERE instead, and the card says so underneath. Every row that broke something carries its own share icon, so you can post a single lift straight from the day it happened without sharing the whole workout.
How It Went charts the session in the order you logged it: one bar per working set, first to last, so the shape of the strip is the shape of the session. Chips above it switch what the bars are shaded by: RPE, load or rest taken. The line underneath says what you are looking at and how it moved, in that metric's own units. Only metrics you actually logged get a chip, so a session with no RPE and no rest times shows the load strip and no controls. Under the strip sits the fatigue band those readings produce, with the signals behind it. It ends by saying how many of the four fatigue signals it could read: a session logged with no RPE and no rest times gives it two at most, and now says so rather than showing the same confident band either way. Notables picks up what nothing else on the page says: your toughest set, your longest rest, any lift you had never logged before, and what the heaviest set was worth against your body weight.
Past workouts aren't read-only. Open a session and choose Edit Workout to fix a typo, change a set's type, add and remove sets, or write the notes you were too rushed to write at the time - Session Notes sits with the name and times at the top, and every exercise gets its own note field under its sets, filled in or not. The same menu offers Share workout card (a shareable image of the session) and Save as New Session, which turns any past workout into a reusable session in one step.
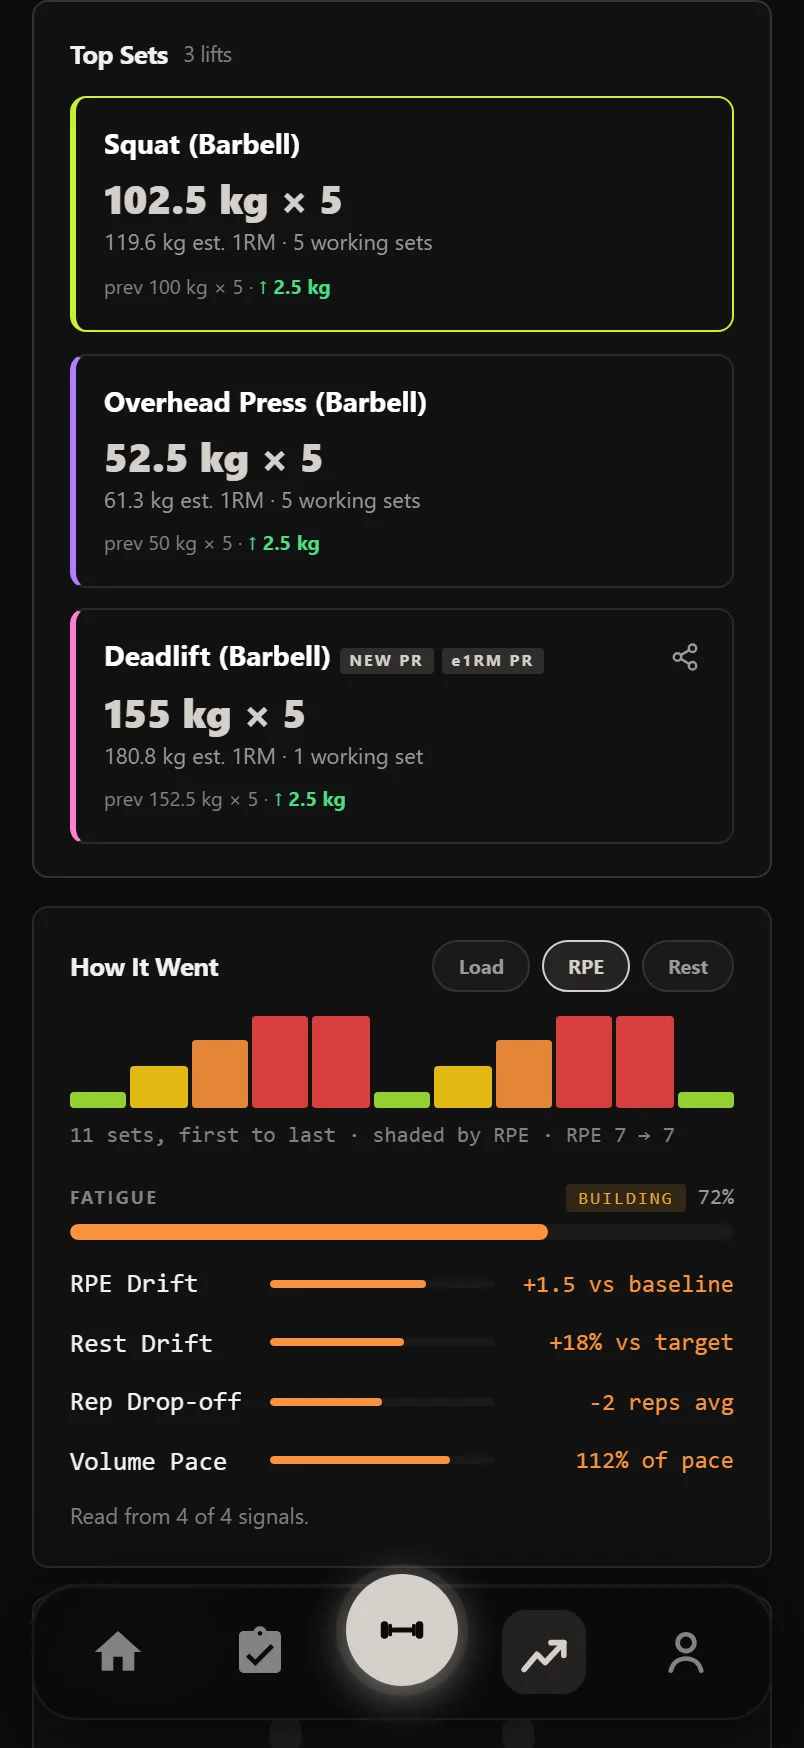
A cardio set edits like any other. Its row in Edit Workout gives a distance box and a duration box, so a ride logged as 2:00 when you rode 20:00 is corrected on the session itself. Type the duration as digits and it groups from the right, so 2000 reads as 20:00.
A session's muscle split shows the front and back bodies side by side, so the whole picture is on screen at once with nothing to flip.
Hover or long-press a bar in How It Went and it names the set it stands for and what that set read, so you can find the one that spiked without counting along the strip.
The share icon on a Top Sets row opens the same certificate gallery as the trophy pop-up you got at the time, scoped to just that record, which is useful when you only spot the milestone weeks later.
The session's opening sentence is also the caption its share card goes out with, so a shared workout says something about itself rather than a generic line.
Session photos stay on the phone that took them and are never uploaded, so the same session opened on another device shows the plain header instead of the photo.
Progress: four swipeable tabs
Everything Durata builds from your sets lives in one place. The Progress hub has four tabs across the top, Review, History, Strength and Workload, and you can swipe left or right anywhere on the panel to move between them. It opens on Review.
Each tab answers a different question. Review is the report: how the last month or year actually went, opening with a shareable recap card. History is the calendar, and the record of every session and every program run. Strength is per-lift: your records, your estimated 1RMs and where you stand. Workload is everything about load rather than any single lift: volume, frequency, recovery and consistency.
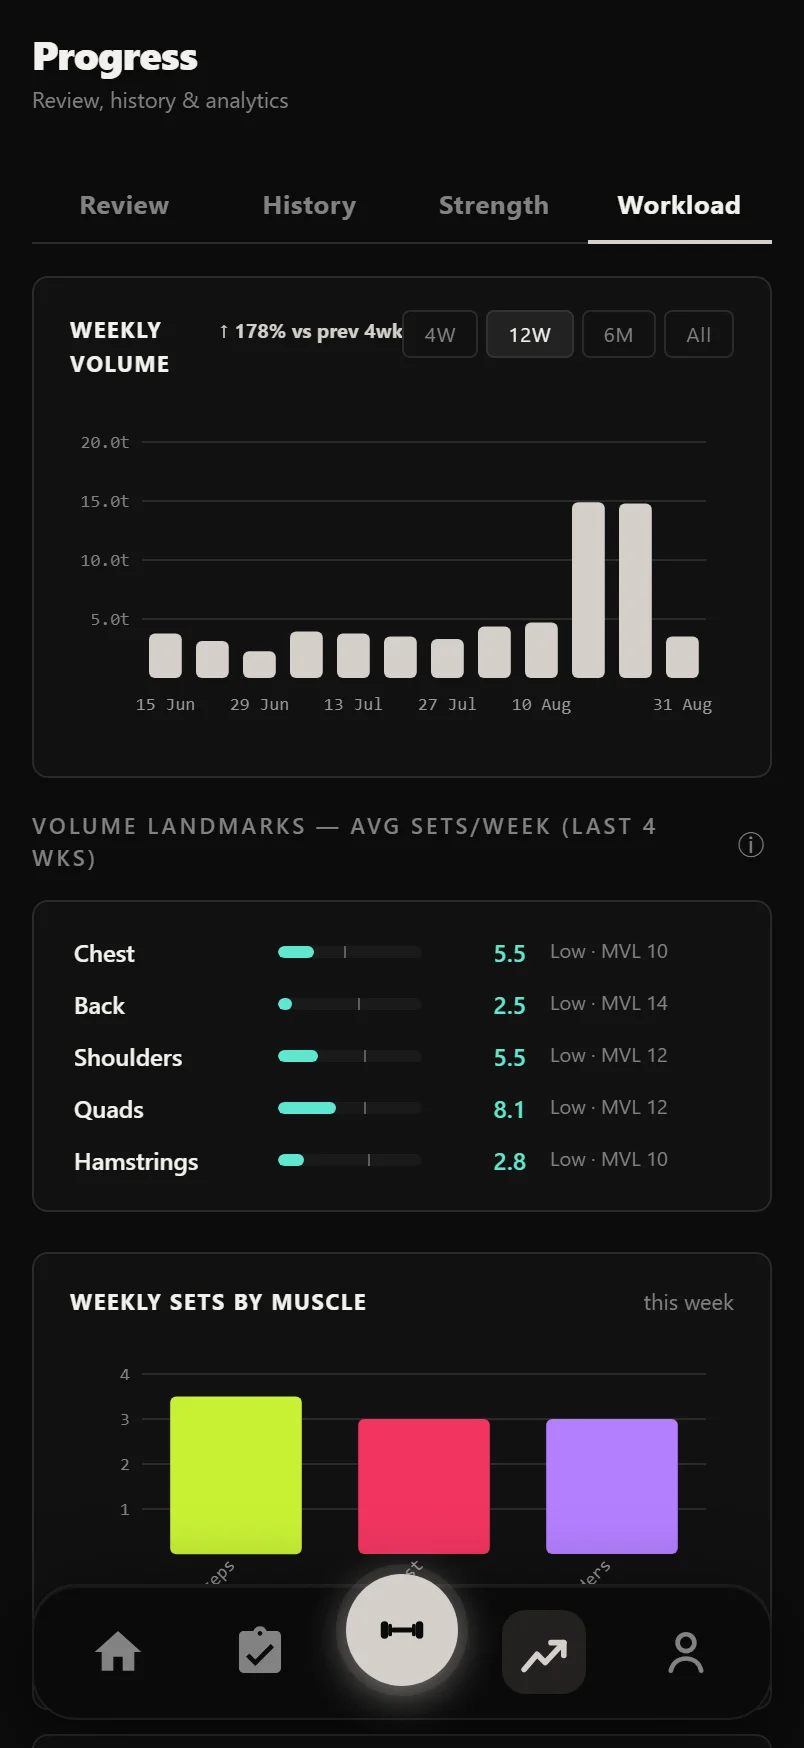
Charts with a funnel icon open a time-range picker: last 7, 30 or 90 days, last year, or all time.
Touch and hold anywhere on a line chart (here, on an exercise's charts, or on the body-weight graph) to read the exact value and date for the nearest point. Drag along the line to scrub through it.
The Strength tab and estimated 1RM
Durata tracks strength through estimated 1RM (e1RM): the single-rep max implied by any set, calculated from weight and reps with the Epley formula. It's how 100 kg for 5 can be compared against 110 kg for 2, and it's the same calculation on every screen in the app.
The Strength tab is built around it. Records lists your best lifts, and Compare Exercises plots any of them side by side over your chosen date range. The Strength Index adds up your Big 4 e1RMs, meaning Squat, Bench Press, Deadlift and Overhead Press, into one number you can watch climb, and 1RM Projections charts where your most-logged lifts are heading. Strength Standards places each lift on an untrained-to-elite scale for your bodyweight, the Imbalance Detector reads your push/pull and quad/hamstring set ratios over the last 4 weeks, and Near PRs lists every lift that came within 10% of a record in the same window, which is what's ripe for an attempt. Records, the Strength Index, 1RM Projections and Near PRs are free. Compare Exercises, Strength Standards and the Imbalance Detector are the verdict cards on this tab and are part of Pro: on a free account the card keeps its title and blurs its reading behind one Unlock with Pro pill, and only once it has something to show.
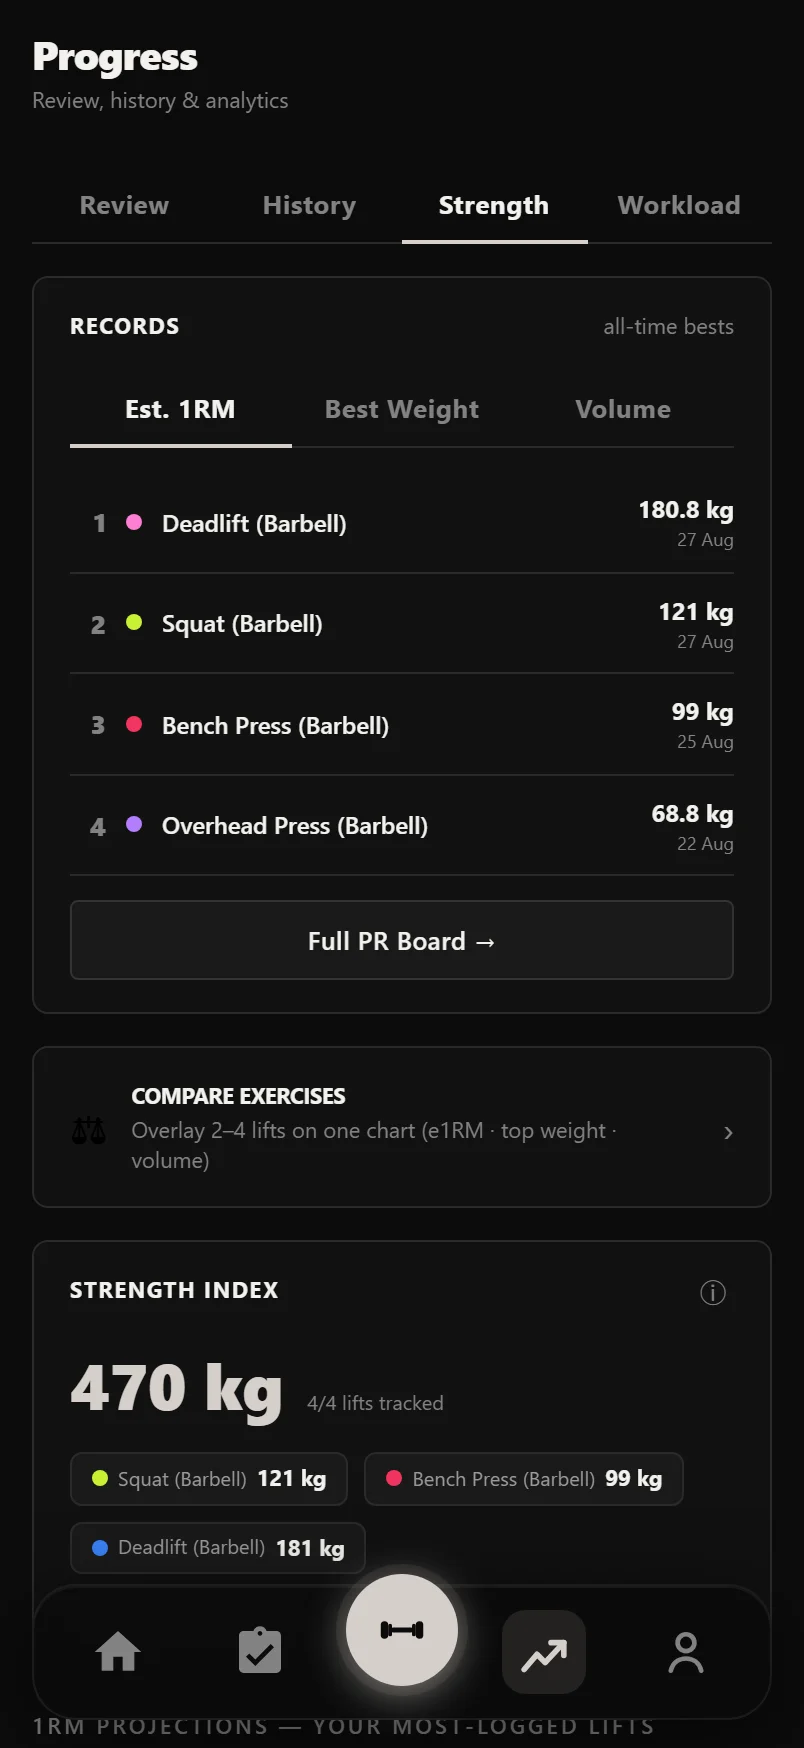
Compare Exercises has an expand icon above its chart. Tap it to see the comparison full-screen with every lift's latest value listed underneath in its own colour, which is the easiest way to read four lines at once.
Tap the small ⓘ button on Strength Index, Near PRs, Strength Standards, the Imbalance Detector, training load, Volume Landmarks, the Muscle Heatmap and the Recovery Score for a one-paragraph explanation of exactly how that number is worked out.
The Workload tab: volume and recovery
Workload watches how much you are doing rather than how strong you are. Weekly Volume, Weekly Sets by Muscle and a this-week-versus-last-week comparison cover the load itself, and a Volume Landmarks card ranks each muscle's average sets per week against the volume it actually needs; a 12-week consistency score, training frequency, favourite training days and a time-of-day heatmap of when you actually train cover the habit. A training-load card compares your last 7 days of volume against your average week over the 4 weeks before them: 1.0× means this week matched your recent normal, 1.5× means half again as much, and a chart shows how that has moved week by week. It describes what changed rather than scoring you, since a jump can just as easily mean a new accessory or a heavier block as too much, and it stays blank until there are enough recent weeks to compare against.
Workload is also where Instant Insights lives. It is a full-screen run through everything you have ever logged, one card at a time: lifetime totals, a record book, a full-history trend chart for your top lift, a lift race, a muscle map, your training rhythm and the milestone clubs you have joined, finishing on where that top lift is heading next. Tap Play once you have five workouts behind you. It is open to every account, whether you imported your history or logged all of it here, and each time you play it the opening card is what has changed since you last watched. It is not another Review: Review reports one period and compares it with the period before, while Insights tells the story of the whole logbook and ends on a suggestion.
The Muscle Heatmap sits here too, painting the last 30 days of working sets straight onto a body: each muscle brightens in steps as its set count climbs, so a well-trained month lights up and a neglected muscle stays dark. An exercise's primary muscle counts each set in full and secondaries count half, and the chart beside the body lists the exact numbers, including the zeros, which are usually the most useful rows on it. The body model follows the Sex setting in your profile.
A fatigue and recovery card tracks volume load, RPE trend and frequency, gives you a single recovery score, and charts that score week by week over the last 12 weeks so you can see fatigue building or clearing. Signals you have no data for are left out rather than counted as average, and the score waits for about a month of training before it appears at all, because a number built on one stray session would only look precise. A deload recommendation watches four warning signals and says plainly when two or more of them point the same way. If you sync sleep through Apple Health or Health Connect, it's folded into the score and a Sleep & Performance section shows how your volume differs after good and poor nights. Per-program analytics are not a tab here any more: every plan has its own report, opened from the plan itself or from its card under Past Runs.
The volume, sets, consistency and heatmap cards are free. The training-load card, the recovery score, the deload recommendation and Sleep & Performance are the cards that give a verdict, and they are part of Pro: each blurs its reading behind one Unlock with Pro pill once it has data, and stays plain until then.
Swipe the Muscle Heatmap sideways, or tap Front / Back underneath it, to flip between the two views. The body and its chart move together, so each side lists only the muscles you're actually looking at.
The PR Board
The PR Board keeps one record card per exercise across three tabs: Est. 1RM, Best Weight and Volume. Each card shows the record, the set that produced it, and how much it beat your previous best by. A volume record is one set's work - weight times reps on your single best set - not the session total, so breaking it takes a genuinely harder set, and adding more sets at the same weight never counts. The board reopens on the tab you were last on.
Volume records on dips, pull-ups, chin-ups and push-ups include your body weight (from your most recent weigh-in within 30 days), so an unweighted set of pull-ups can genuinely hold a volume record. Assisted variants score volume as body weight minus the assistance - and they never hold weight or e1RM records, because a heavier assistance stack is an easier set, not a stronger one.
Records are strict by design: warm-ups, partials and rest-pause sets never count towards weight or e1RM records, and your very first session of an exercise sets the baseline rather than being awarded as a PR, because a record has to beat something you had already done before that session. A later set in that first session beating an earlier one is not a record either, on the live badge or anywhere else. The card says which it is: a first log reads BASELINE · first log, nothing to beat yet and has no share icon, while every card that broke something names the age of what it broke, as in Beat 84-day record. Until your first record falls, the header counter reads Baselines Set rather than a month of PRs you did not set. Two buttons in the header run the board: Sort orders it by date, value or name, and Filter narrows it to one muscle group. Each button shows what's currently in effect, so you can tell at a glance how the board is arranged.
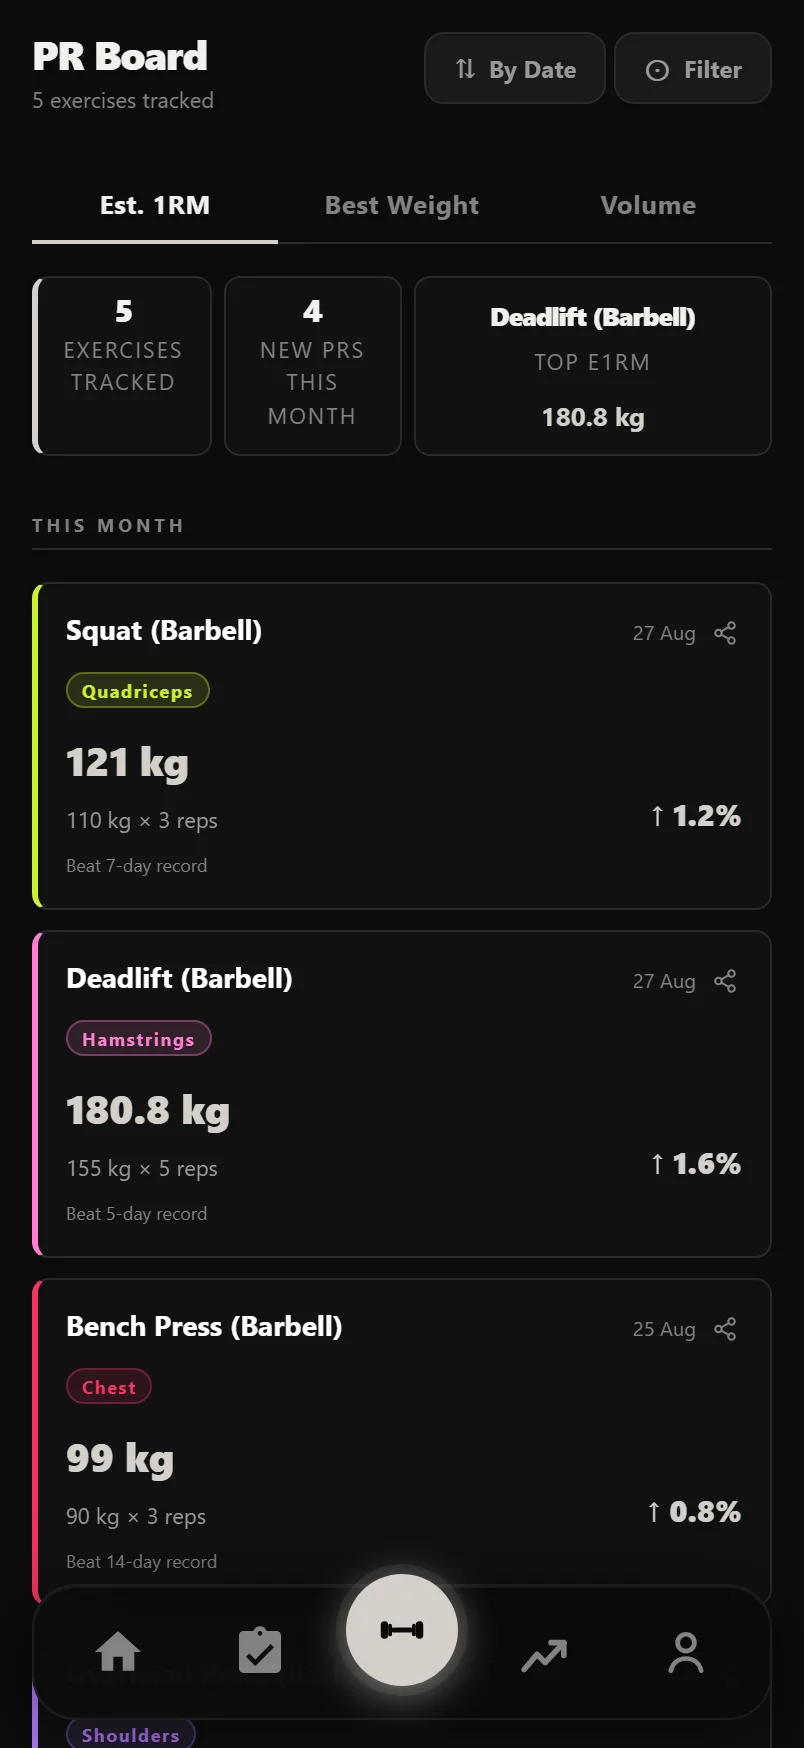
Swipe left or right on the grid to cycle between the three record types.
Once a card has beaten something it carries its own share icon, opening a card for that exact record, the one on the tab you're viewing.
Tap any PR tile to jump straight to that exercise's detail page and full history.
Sorting by date groups the board into periods (Last 7 Days, This Month, and so on); the other two orders give you one flat grid.
The Review tab: monthly and yearly reports
The first tab in Progress is Review, a full report on any month or year you've trained. It opens on your most recent completed month, leads with a shareable recap card, then breaks the period down: a day-by-day training strip, total volume against the previous period, every PR you set, and your top lifts with how their estimated 1RM moved. Any program you ran that period is listed too, so you can jump into its own report.
The whole guide to reading a report, sharing it, and what every section means has its own page.
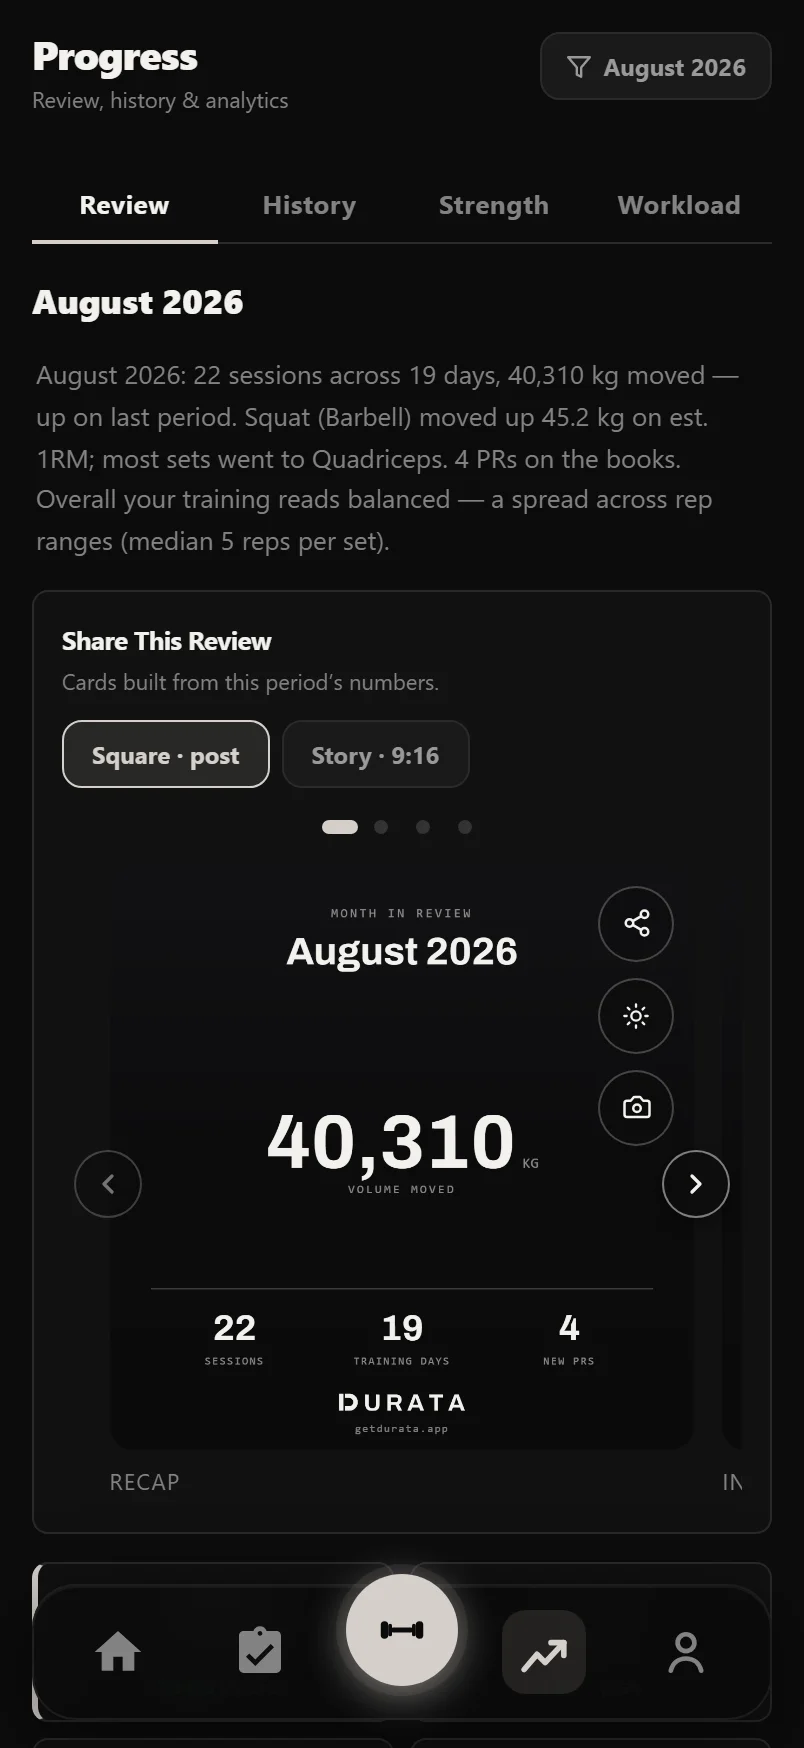
Reviewing the current month is fine: it's labelled 'so far' and fills in as you train.
Goals and the ETA forecast
You can set up to 10 goals across nine types: body weight, body fat %, max weight or estimated 1RM on a lift, reps at a given weight, cardio sessions, running distance, workout count and total volume, with the count-based ones scoped per week, month or year. Both cardio goals count the same two places cardio comes from — a session synced from your phone's health app, and a cardio exercise logged inside a workout — so a 5 km ride you logged as part of a session moves a running-distance goal by 5 km, and counts once, not twice. Pin up to 3 goals to your dashboard, and archive finished ones to keep the list clean.
Strength goals forecast their own finish date. Durata fits a trend line through your per-session bests for that lift and projects when it crosses your target. That is the date on the card. With sparse history it falls back to a simpler estimate and marks it as rough; if your trend is flat, the card says 'Keep logging' instead of inventing a date.
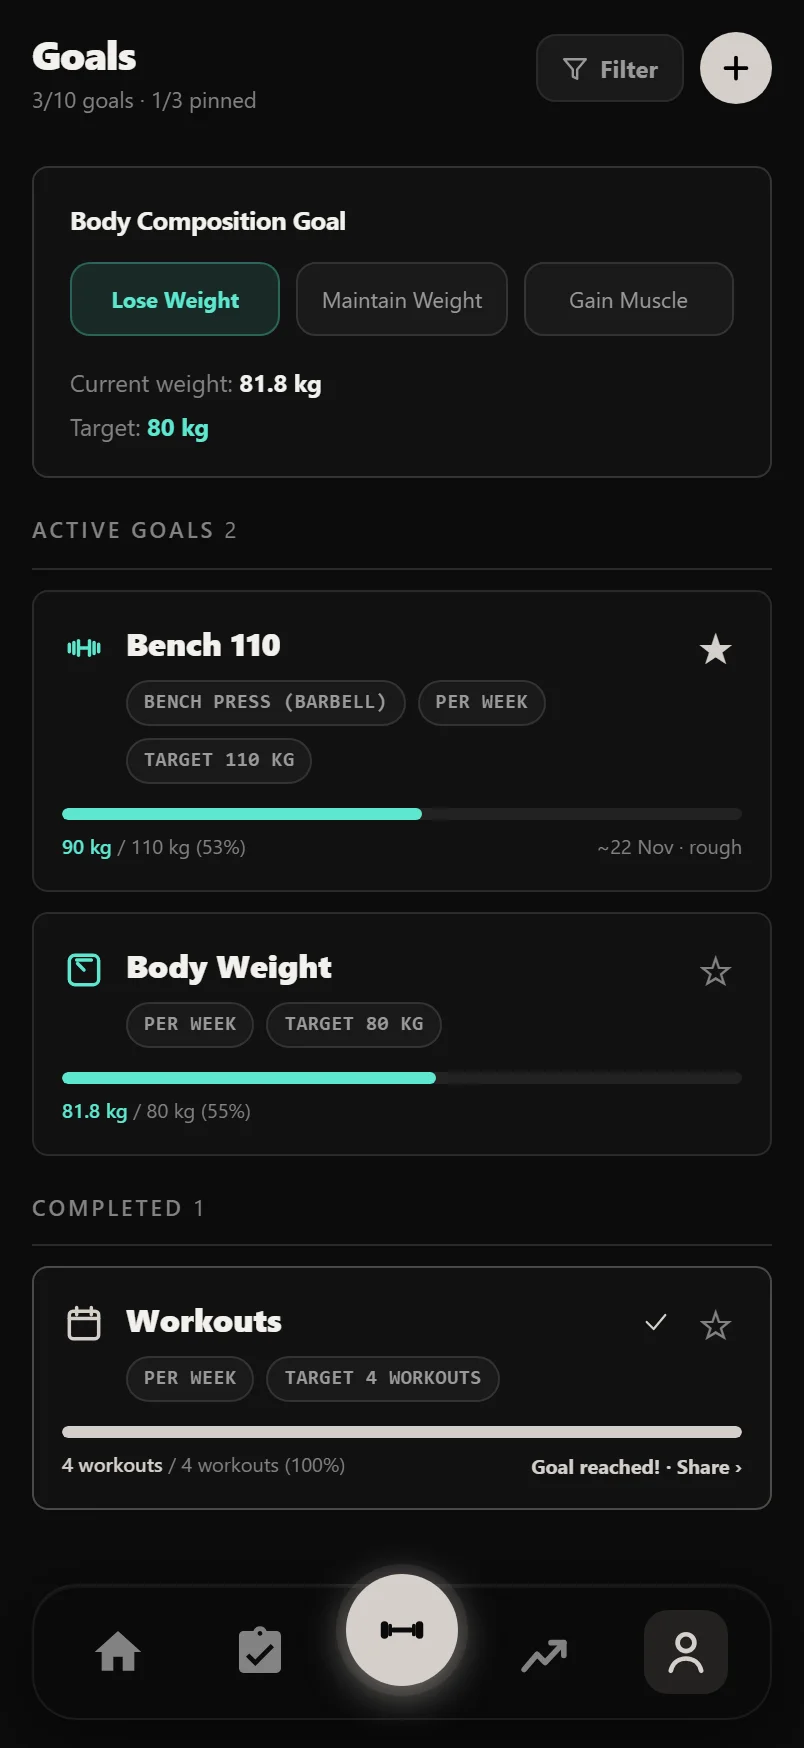
Tap any goal card to edit it. The star in its corner (same as on routine cards) pins it to the dashboard or takes it off without opening the editor.
Common questions
How is estimated 1RM calculated?
From your best set using the Epley formula: weight multiplied by (1 + reps/30). It's the same calculation everywhere in Durata, in the logger, PR board, analytics and goals, so numbers always agree across screens.
Why didn't my set count as a PR?
Records are strict: warm-up, partial and rest-pause sets never qualify for weight or e1RM records, and volume records count partials as half-reps and are measured on your best single set, not the session total. The very first session of an exercise sets your baseline rather than earning a PR, so a later set beating an earlier one in that same first session is not a record. If a heavy set didn't register, check its set type. Assisted pull-up and dip variants never hold weight or e1RM records at all - their progress shows up as volume instead.
Where did the Personal Records card on a session go?
Onto the lifts themselves. A record used to be named three times on one session page: once in Insights, once in a Personal Records card and once in the top-sets comparison. You had to line the three up to see they were one event. Now each Top Sets row carries the tags for the records that lift broke, and its own share icon.
Can I edit a workout I logged last week?
Yes. Open it from the History calendar, choose Edit Workout, and you can change weights and reps, switch set types, add or remove sets, and add or reword the session and per-exercise notes. Your PRs and analytics update to match.
What does 'rough' mean next to a goal's ETA?
The forecast didn't have enough consistent history to fit a reliable trend line, so it used a simpler estimate based on your progress since the goal was created. Keep logging that lift and it upgrades to a trend-based projection.
Put it into practice
Durata is free to use — 50 proven programs, automatic progression, rest timers and PR tracking, all on your phone.